
Canvas & charts
Draw charts, meters and dials with vector primitives inside the layout: lines, arcs, curves and gradient fills.
Utilities cover boxes and text. For charts, meters, dials and anything else that is drawn rather than laid out, use ui.canvas: the element takes part in layout like any other box, and a procedure you supply draws into its rect with vector primitives.
Drawing primitives
Section titled “Drawing primitives”| Class | Effect |
|---|---|
ui.canvas(class, draw, data) |
box whose content is drawn by draw(ctx, rect, data) every frame |
ui.draw_rect(ctx, rect, color, radius) |
filled (rounded) rectangle |
ui.draw_line(ctx, a, b, color, width) |
anti-aliased segment with round caps |
ui.draw_polyline(ctx, points, color, width) |
connected segments: curves, waveforms |
ui.draw_arc(ctx, center, r, start, sweep, color, width) |
stroked arc, radians clockwise from +x |
ui.draw_circle(ctx, center, r, color) |
filled disc |
ui.draw_area(ctx, points, base_y, top, bottom) |
fill under a curve with a vertical gradient |
ui.oklch(l, c, h) |
colors in OKLCH, the same space as Tailwind v4 and modern CSS |
Coordinates are logical pixels in window space; the renderer scales them to the display. Every primitive is one GPU instance shaded with a signed distance function, so edges are anti-aliased at any scale and nothing is tessellated on the CPU. A 160-point curve costs 160 instances; a full mixing-desk screen stays around 600.
Frequency response
Section titled “Frequency response”draw_area fills under the curve with a gradient, draw_polyline strokes it, draw_circle marks the band nodes.
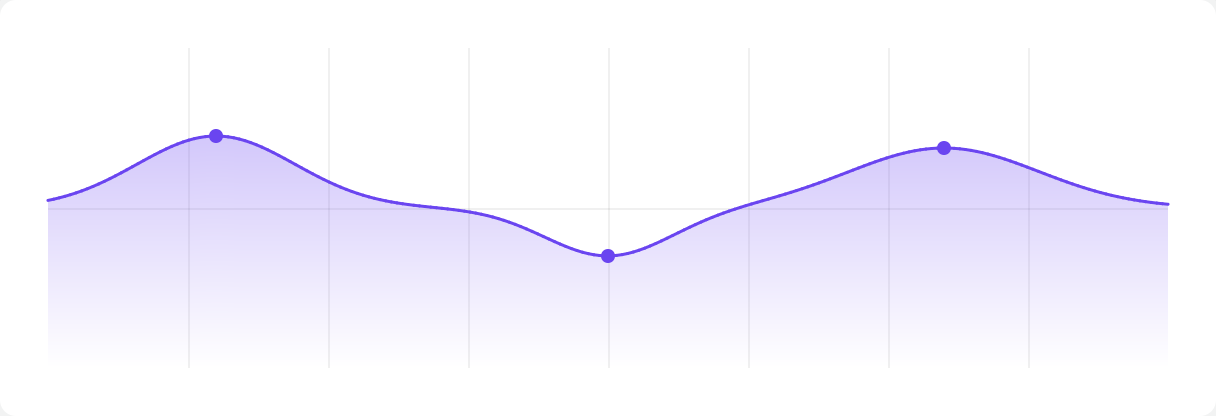
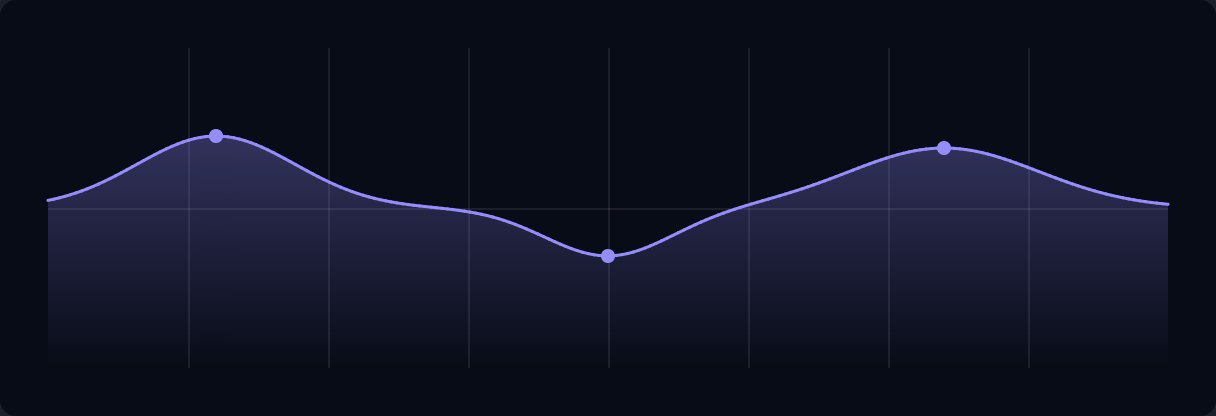
ui.canvas("h-40 w-full", eq_chart)A 270° dial is two arcs and a pointer line. The canvas sits in a normal flex layout with its label underneath.


if ui.div("flex gap-8") { values := [4]f32{0.15, 0.4, 0.65, 0.9} for v, i in values { ui.push_id(i) if ui.div("flex flex-col items-center gap-1") { d := new(f32, context.temp_allocator) d^ = v ui.canvas("size-12", dial, d) ui.text(DIAL_LABELS[i], "text-xs font-medium tracking-wide text-gray-500 dark:text-gray-400") } ui.pop_id() }}Live sparklines
Section titled “Live sparklines”Canvases redraw every frame, so they can follow live data. These lines are driven by the clock.
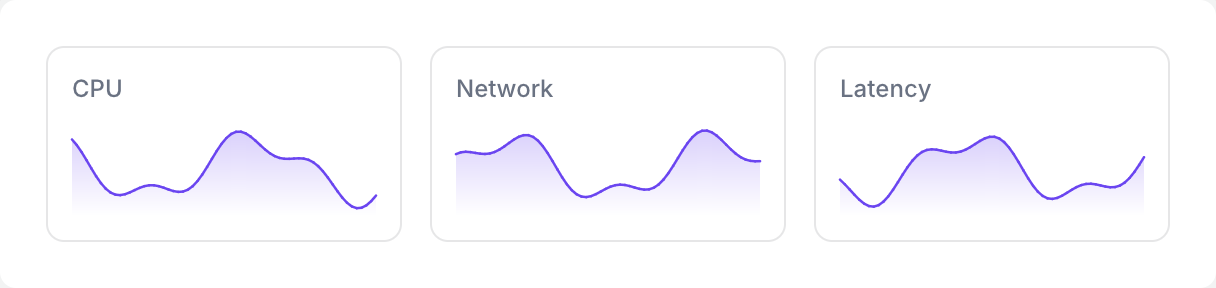
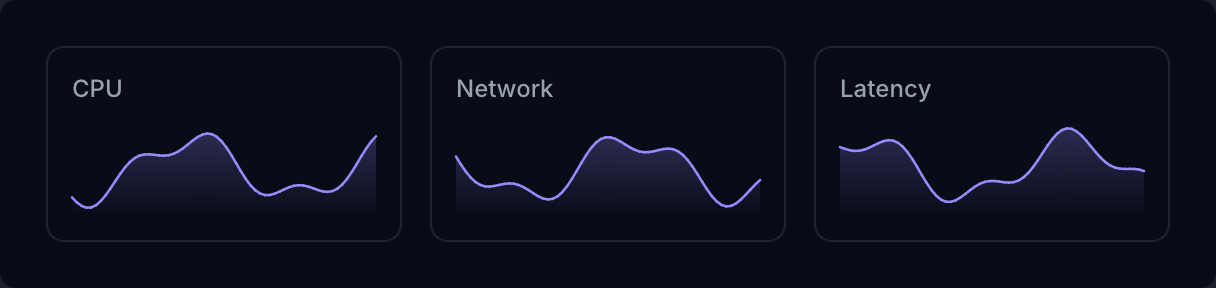
if ui.div("grid grid-cols-3 gap-4") { for i in 0 ..< 3 { ui.push_id(i) if ui.div("rounded-lg p-3 ring-1 ring-gray-950/10 dark:ring-white/10") { ui.text(SPARK_LABELS[i], "text-xs font-medium text-gray-500 dark:text-gray-400") d := new(int, context.temp_allocator) d^ = i ui.canvas("mt-2 h-12 w-full", sparkline, d) } ui.pop_id() }}